

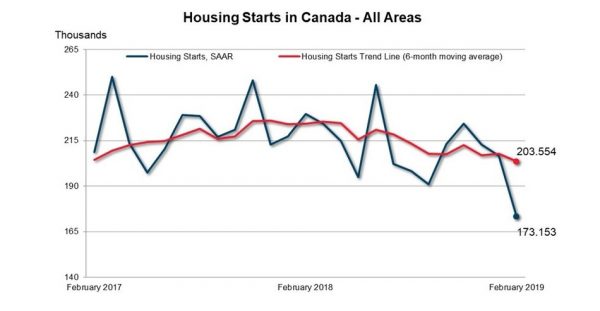
OTTAWA, March 8, 2019 /CNW/ – The trend in housing starts was 203,554 units in February 2019, compared to 207,742 units in January 2019, according to Canada Mortgage and Housing Corporation (CMHC). This trend measure is a six-month moving average of the monthly seasonally adjusted annual rates (SAAR) of housing starts.
“The national trend in housing starts resumed its downward trajectory in February while still remaining above historical average,” said Bob Dugan, CMHC’s chief economist. “Both single-detached and multi-unit dwellings starts trended lower. Higher mortgage rates combined with still-favourable, but less stimulative economic conditions have contributed to softer demand on new home markets in urban centres.”
Monthly Highlights
c
The trend measure for February 2019 housing starts in the Vancouver Census Metropolitan Area (CMA) remained steady at a similar level as January. However, compared to the same month last year, the share of single starts decreased while condo starts rose to 77% of all new housing units in the CMA this month. This growth is led by Burnaby’s condo sector, which accounted for 50% of all new construction activities for the month.
Victoria
The February 2019 trend measure for housing starts in Metro Victoria declined from a recent high-water mark in December. However, new condo construction boosted total housing starts above the level reached in the same period last year. The relative affordability of condo units as compared to single detached units has helped bolster demand for new units.
Edmonton
Housing starts in all segments of the market trended lower in February. While the number of starts and units under construction has been slowing in recent months, the number of completions continue to outpace absorptions, which is contributing to rising inventory levels in the ownership market. The slow economic recovery across Alberta combined with other demand headwinds continue to impact homeownership activity in Edmonton.
Regina
The total housing starts trended down in the Regina CMA in February after construction activity slowed in both single-detached and multi-unit segments. Actual starts during the second month of 2019 totalled 27 units, compared to 140 units in the same month a year earlier. A series of factors including weaker economic conditions, higher borrowing costs and inclement weather have significantly reduced homebuilding activity so far this year.
Toronto
Total housing starts in the Toronto CMA trended lower in February mainly due to low condominium apartment starts. Row and semi-detached home starts trended higher underlining their popularity among buyers looking for lower priced ground-oriented homes. Fewer pre-construction sales on single-detached homes throughout 2018 will continue to result in fewer starts in 2019. Conversely, sales of new condominium apartment starts have been strong in 2017 and 2018 and these units will continue to break ground throughout this year at a varying pace.
Hamilton
Row and apartment starts remained high and decreased less than single-detached starts, which were already very sluggish. A wider gap has developed between the number of multi-unit housing starts and single-detached starts because buyers had their purchasing power reduced in the past 6 to 12 months due to rising carrying costs. Pre-construction sales of new single-detached homes during that time, which are now turning into starts, suffered the most of any dwelling type due to their generally higher price tag.
St. Catharines
New home starts in the St. Catharines CMA continued their upward trend in February 2019 to reach a 10-month high, to a large extent thanks to stronger row and apartment starts. The affordability advantage relative to the nearby communities and the future expansion of the rapid transit network to the region continue to support construction of new homes.
Windsor
The housing starts trend fell for the third month in a row in February. This month’s decline was marked by fewer single-detached and row starts, while apartment starts went in the opposite direction. Due to fewer new listings of lower priced housing in the resale market, there has been growing need for new condominium apartments. This has resulted in the apartment starts trend rising to its hightest level in the past decade.
Sherbrooke
In the first two months of 2019, housing starts in the Sherbrooke CMA were up compared to the same period in 2018. This increase was attributable to both rental housing, particularly seniors’ residences, and freehold (single-detached, semi-detached, row and duplex) homes. Residential construction in the area has continued to be stimulated by the rise in full-time employment, migration and the aging of the population.
Montréal
Total housing starts in the Montréal area in the first two months of the year were down from the corresponding period in 2018. However, unlike condominium and single-family home building, rental apartment construction has continued to show strong growth. The low vacancy rates, the aging of the population and the greater proportion of young households now opting for the rental market have continued to stimulate rental housing starts.
Halifax
Total housing starts in February expanded by 25% year-over-year as construction on the multiples market in Halifaxremains strong. While single-detached starts were stable compared to the same period last year, continued population growth from both international and interprovincial migration, combined with low vacancy rates are driving elevated levels of rental apartment construction.
CMHC uses the trend measure as a complement to the monthly SAAR of housing starts to account for considerable swings in monthly estimates and obtain a more complete picture of Canada’s housing market. In some situations analyzing only SAAR data can be misleading, as they are largely driven by the multi-unit segment of the market which can vary significantly from one month to the next.
The standalone monthly SAAR of housing starts for all areas in Canada was 173,153 units in February, down 16.3% from 206,809 units in January. The SAAR of urban starts decreased by 18.0% in February to 155,663 units. Multiple urban starts decreased by 20.2% to 116,284 units in February while single-detached urban starts decreased by 10.6% to 39,379 units.
Rural starts were estimated at a seasonally adjusted annual rate of 17,490 units.
Preliminary Housing Starts data are also available in English and French through our website and through CMHC’s Housing Market Information Portal. Our analysts are also available to provide further insight into their respective markets.
As Canada’s authority on housing, CMHC contributes to the stability of the housing market and financial system, provides support for Canadians in housing need, and offers objective housing research and information to Canadian governments, consumers and the housing industry.
For more information, follow us on Twitter, YouTube, LinkedIn, Facebook and Instagram.
|
Preliminary Housing Start Data in Centres 10,000 Population and Over |
|||||||||||
|
Single-Detached |
All Others |
Total |
|||||||||
|
February |
February |
% |
February |
February |
% |
February |
February |
% |
|||
|
Provinces (10,000+) |
|||||||||||
|
N.-L. |
16 |
5 |
-69 |
2 |
9 |
350 |
18 |
14 |
-22 |
||
|
P.E.I. |
6 |
6 |
– |
24 |
0 |
-100 |
30 |
6 |
-80 |
||
|
N.S. |
83 |
57 |
-31 |
174 |
196 |
13 |
257 |
253 |
-2 |
||
|
N.B. |
12 |
6 |
-50 |
1 |
0 |
-100 |
13 |
6 |
-54 |
||
|
Atlantic |
117 |
74 |
-37 |
201 |
205 |
2 |
318 |
279 |
-12 |
||
|
Qc |
189 |
182 |
-4 |
2,291 |
1,753 |
-23 |
2,480 |
1,935 |
-22 |
||
|
Ont. |
1,315 |
746 |
-43 |
5,902 |
2,761 |
-53 |
7,217 |
3,507 |
-51 |
||
|
Man. |
141 |
125 |
-11 |
176 |
201 |
14 |
317 |
326 |
3 |
||
|
Sask. |
75 |
48 |
-36 |
146 |
24 |
-84 |
221 |
72 |
-67 |
||
|
Alta. |
783 |
518 |
-34 |
924 |
876 |
-5 |
1,707 |
1,394 |
-18 |
||
|
Prairies |
999 |
691 |
-31 |
1,246 |
1,101 |
-12 |
2,245 |
1,792 |
-20 |
||
|
B.C. |
544 |
442 |
-19 |
1,893 |
2,429 |
28 |
2,437 |
2,871 |
18 |
||
|
Canada (10,000+) |
3,164 |
2,135 |
-33 |
11,533 |
8,249 |
-28 |
z14,697 |
10,384 |
-29 |
||
|
Metropolitan Areas |
|||||||||||
|
Abbotsford-Mission |
24 |
19 |
-21 |
30 |
100 |
233 |
54 |
119 |
120 |
||
|
Barrie |
54 |
3 |
-94 |
74 |
72 |
-3 |
128 |
75 |
-41 |
||
|
Belleville |
8 |
5 |
-38 |
0 |
0 |
– |
8 |
5 |
-38 |
||
|
Brantford |
17 |
14 |
-18 |
0 |
14 |
## |
17 |
28 |
65 |
||
|
Calgary |
296 |
207 |
-30 |
282 |
395 |
40 |
578 |
602 |
4 |
||
|
Edmonton |
346 |
221 |
-36 |
487 |
383 |
-21 |
833 |
604 |
-27 |
||
|
Greater Sudbury |
0 |
0 |
– |
0 |
0 |
– |
0 |
0 |
– |
||
|
Guelph |
8 |
6 |
-25 |
36 |
170 |
372 |
44 |
176 |
300 |
||
|
Halifax |
33 |
30 |
-9 |
136 |
181 |
33 |
169 |
211 |
25 |
||
|
Hamilton |
61 |
25 |
-59 |
96 |
123 |
28 |
157 |
148 |
-6 |
||
|
Kelowna |
22 |
15 |
-32 |
15 |
8 |
-47 |
37 |
23 |
-38 |
||
|
Kingston |
8 |
2 |
-75 |
16 |
0 |
-100 |
24 |
2 |
-92 |
||
|
Kitchener-Cambridge-Waterloo |
114 |
63 |
-45 |
105 |
24 |
-77 |
219 |
87 |
-60 |
||
|
Lethbridge |
33 |
8 |
-76 |
5 |
44 |
## |
38 |
52 |
37 |
||
|
London |
111 |
50 |
-55 |
20 |
23 |
15 |
131 |
73 |
-44 |
||
|
Moncton |
4 |
2 |
-50 |
0 |
0 |
– |
4 |
2 |
-50 |
||
|
Montréal |
114 |
90 |
-21 |
1,947 |
1,000 |
-49 |
2,061 |
1,090 |
-47 |
||
|
Oshawa |
104 |
12 |
-88 |
6 |
19 |
217 |
110 |
31 |
-72 |
||
|
Ottawa-Gatineau |
75 |
87 |
16 |
68 |
727 |
## |
143 |
814 |
469 |
||
|
Gatineau |
16 |
8 |
-50 |
10 |
122 |
## |
26 |
130 |
400 |
||
|
Ottawa |
59 |
79 |
34 |
58 |
605 |
## |
117 |
684 |
485 |
||
|
Peterborough |
17 |
3 |
-82 |
0 |
0 |
– |
17 |
3 |
-82 |
||
|
Québec |
10 |
24 |
140 |
42 |
83 |
98 |
52 |
107 |
106 |
||
|
Regina |
32 |
18 |
-44 |
108 |
9 |
-92 |
140 |
27 |
-81 |
||
|
Saguenay |
3 |
2 |
-33 |
0 |
14 |
## |
3 |
16 |
433 |
||
|
St. Catharines-Niagara |
70 |
53 |
-24 |
68 |
106 |
56 |
138 |
159 |
15 |
||
|
Saint John |
2 |
1 |
-50 |
0 |
0 |
– |
2 |
1 |
-50 |
||
|
St. John’s |
13 |
5 |
-62 |
2 |
9 |
350 |
15 |
14 |
-7 |
||
|
Saskatoon |
37 |
27 |
-27 |
33 |
15 |
-55 |
70 |
42 |
-40 |
||
|
Sherbrooke |
4 |
8 |
100 |
83 |
291 |
251 |
87 |
299 |
244 |
||
|
Thunder Bay |
0 |
1 |
## |
0 |
0 |
– |
0 |
1 |
## |
||
|
Toronto |
394 |
183 |
-54 |
5,283 |
1,403 |
-73 |
5,677 |
1,586 |
-72 |
||
|
Trois-Rivières |
5 |
0 |
-100 |
2 |
30 |
## |
7 |
30 |
329 |
||
|
Vancouver |
273 |
208 |
-24 |
1,347 |
1,791 |
33 |
1,620 |
1,999 |
23 |
||
|
Victoria |
50 |
39 |
-22 |
261 |
299 |
15 |
311 |
338 |
9 |
||
|
Windsor |
28 |
13 |
-54 |
43 |
42 |
-2 |
71 |
55 |
-23 |
||
|
Winnipeg |
127 |
112 |
-12 |
121 |
192 |
59 |
248 |
304 |
23 |
||
|
Total |
2,497 |
1,556 |
-38 |
10,716 |
7,567 |
-29 |
13,213 |
9,123 |
-31 |
||
|
Data based on 2016 Census Definitions. |
|||||||||||
|
Source: Market Analysis Centre, CMHC |
|||||||||||
|
## not calculable / extreme value |
|||||||||||
|
Preliminary Housing Start Data – Seasonally Adjusted at Annual Rates (SAAR) |
|||||||||||
|
Single-Detached |
All Others |
Total |
|||||||||
|
January |
February |
% |
January |
February |
% |
January |
February |
% |
|||
|
Provinces (10,000+) |
|||||||||||
|
N.L. |
381 |
260 |
-32 |
50 |
113 |
126 |
431 |
373 |
-13 |
||
|
P.E.I. |
100 |
309 |
209 |
540 |
0 |
-100 |
640 |
309 |
-52 |
||
|
N.S. |
1,493 |
1,240 |
-17 |
1,939 |
2,479 |
28 |
3,432 |
3,719 |
8 |
||
|
N.B. |
457 |
455 |
0 |
855 |
13 |
-98 |
1,312 |
468 |
-64 |
||
|
Qc |
4,730 |
5,886 |
24 |
36,219 |
29,019 |
-20 |
40,949 |
34,905 |
-15 |
||
|
Ont. |
16,384 |
13,863 |
-15 |
55,831 |
41,879 |
-25 |
72,215 |
55,742 |
-23 |
||
|
Man. |
1,980 |
1,931 |
-2 |
3,636 |
2,412 |
-34 |
5,616 |
4,343 |
-23 |
||
|
Sask. |
1,259 |
893 |
-29 |
816 |
288 |
-65 |
2,075 |
1,181 |
-43 |
||
|
Alta. |
9,397 |
7,329 |
-22 |
13,288 |
10,747 |
-19 |
22,685 |
18,076 |
-20 |
||
|
B.C. |
7,878 |
7,213 |
-8 |
32,529 |
29,334 |
-10 |
40,407 |
36,547 |
-10 |
||
|
Canada (10,000+) |
44,059 |
39,379 |
-11 |
145,703 |
116,284 |
-20 |
189,762 |
155,663 |
-18 |
||
|
Canada (All Areas) |
56,444 |
51,997 |
-8 |
150,364 |
121,153 |
-19 |
206,809 |
173,153 |
-16 |
||
|
Metropolitan Areas |
|||||||||||
|
Abbotsford-Mission |
431 |
306 |
-29 |
384 |
1,200 |
213 |
815 |
1,506 |
85 |
||
|
Barrie |
358 |
171 |
-52 |
0 |
864 |
## |
358 |
1,035 |
189 |
||
|
Belleville |
394 |
300 |
-24 |
0 |
0 |
– |
394 |
300 |
-24 |
||
|
Brantford |
150 |
236 |
57 |
0 |
168 |
## |
150 |
404 |
169 |
||
|
Calgary |
3,794 |
3,004 |
-21 |
5,172 |
4,740 |
-8 |
8,966 |
7,744 |
-14 |
||
|
Edmonton |
3,768 |
3,187 |
-15 |
6,948 |
4,596 |
-34 |
10,716 |
7,783 |
-27 |
||
|
Greater Sudbury |
93 |
137 |
47 |
24 |
0 |
-100 |
117 |
137 |
17 |
||
|
Guelph |
195 |
83 |
-57 |
228 |
2,040 |
## |
423 |
2,123 |
402 |
||
|
Halifax |
994 |
800 |
-20 |
1,692 |
2,172 |
28 |
2,686 |
2,972 |
11 |
||
|
Hamilton |
476 |
371 |
-22 |
3,624 |
1,476 |
-59 |
4,100 |
1,847 |
-55 |
||
|
Kelowna |
992 |
233 |
-77 |
3,216 |
96 |
-97 |
4,208 |
329 |
-92 |
||
|
Kingston |
625 |
73 |
-88 |
1,764 |
0 |
-100 |
2,389 |
73 |
-97 |
||
|
Kitchener-Cambridge-Waterloo |
1,374 |
990 |
-28 |
960 |
288 |
-70 |
2,334 |
1,278 |
-45 |
||
|
Lethbridge |
596 |
92 |
-85 |
84 |
528 |
## |
680 |
620 |
-9 |
||
|
London |
1,065 |
895 |
-16 |
2,712 |
276 |
-90 |
3,777 |
1,171 |
-69 |
||
|
Moncton |
3 |
166 |
## |
24 |
0 |
-100 |
27 |
166 |
## |
||
|
Montréal |
2,254 |
2,109 |
-6 |
17,384 |
12,774 |
-27 |
19,638 |
14,883 |
-24 |
||
|
Oshawa |
552 |
349 |
-37 |
228 |
228 |
– |
780 |
577 |
-26 |
||
|
Ottawa-Gatineau |
1,906 |
2,060 |
8 |
2,052 |
8,724 |
325 |
3,958 |
10,784 |
172 |
||
|
Gatineau |
59 |
210 |
256 |
744 |
1,464 |
97 |
803 |
1,674 |
108 |
||
|
Ottawa |
1,847 |
1,850 |
0 |
1,308 |
7,260 |
455 |
3,155 |
9,110 |
189 |
||
|
Peterborough |
130 |
114 |
-12 |
0 |
0 |
– |
130 |
114 |
-12 |
||
|
Québec |
423 |
637 |
51 |
1,128 |
996 |
-12 |
1,551 |
1,633 |
5 |
||
|
Regina |
277 |
272 |
-2 |
420 |
108 |
-74 |
697 |
380 |
-45 |
||
|
Saguenay |
124 |
126 |
2 |
0 |
168 |
## |
124 |
294 |
137 |
||
|
St. Catharines-Niagara |
1,192 |
770 |
-35 |
648 |
1,272 |
96 |
1,840 |
2,042 |
11 |
||
|
Saint John |
118 |
80 |
-32 |
444 |
0 |
-100 |
562 |
80 |
-86 |
||
|
St. John’s |
347 |
242 |
-30 |
24 |
108 |
350 |
371 |
350 |
-6 |
||
|
Saskatoon |
909 |
515 |
-43 |
396 |
180 |
-55 |
1,305 |
695 |
-47 |
||
|
Sherbrooke |
122 |
371 |
204 |
0 |
3,492 |
## |
122 |
3,863 |
## |
||
|
Thunder Bay |
5 |
1,428 |
## |
0 |
0 |
– |
5 |
1,428 |
## |
||
|
Toronto |
3,846 |
3,377 |
-12 |
35,304 |
16,836 |
-52 |
39,150 |
20,213 |
-48 |
||
|
Trois-Rivières |
94 |
7 |
-93 |
216 |
360 |
67 |
310 |
367 |
18 |
||
|
Vancouver |
2,924 |
3,514 |
20 |
22,404 |
21,492 |
-4 |
25,328 |
25,006 |
-1 |
||
|
Victoria |
488 |
528 |
8 |
2,424 |
3,588 |
48 |
2,912 |
4,116 |
41 |
||
|
Windsor |
604 |
325 |
-46 |
144 |
504 |
250 |
748 |
829 |
11 |
||
|
Winnipeg |
1,755 |
1,665 |
-5 |
3,528 |
2,304 |
-35 |
5,283 |
3,969 |
-25 |
||
|
Data based on 2016 Census Definitions. |
|||||||||||
|
Source: Market Analysis Centre, CMHC |
|||||||||||
|
## not calculable / extreme value |
|||||||||||